Proven Process with Powerful Tools
MAPPER Computer System Investigation (MCSI) services are based on a proven process
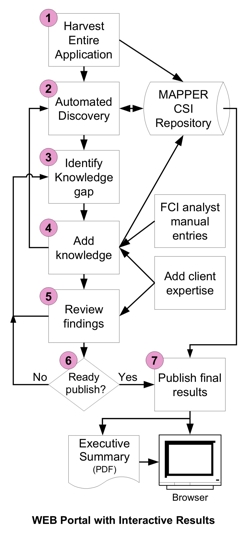
of harvesting human expertise and application inventory, extracting/adding knowledge
during analysis, and documenting the findings. This process has been simplified
in the overview diagram shown below. MCSI is complemented by its powerful
Investigator Tool and Knowledge Repository. An overview of the Investigator quickly reveals
how MCSI divides an application into presentation, business logic, database, and
external systems. The
Repository overview shows how knowledge is built up over the course of the
analysis.
Upon completion of our interview and planning sessions, we commence by harvesting
your applications: RUNs and data reports.
Screens are captured during daily activity by business experts. All components
are stored in the MAPPER CSI repository. (1)
The next step consists of automated discovery through RUN beautification,
cross-referencing, data report grouping and surveying. Results of Organizing prepare your data
for in-depth analysis.(2)
The automated procedures identify gaps in our knowledge. (3)
Client experts help clarify fine points of the application. FCI’s analyst resolves
anomalies, using tool features to increase the “magnification power” of our vision.
We review data
and profile
paragraph and field characteristics showing us current structure and relationship
patterns. The Investigator also generates a
RUN / Data cross-reference which helps us understand how RUNs use the data.
We then edit related
fields, storing our knowledge about potential relational modeling into the
repository. (4)
The RUNs Overview
highlights how we work with RUNs. RUN source code is displayed in the RUN editor. Its associated
outline and search functions provide powerful tools for researching anomalies and
closing the knowledge gap. New knowledge is documented as text annotations which can be merged with
existing RUN comments for a more complete picture. The primary DNA of all MAPPER
applications, its variable and result usage, round out the RUN analysis. (4)
Screens are a crucial
means for understanding the application. Screens captured during normal activity
are linked to the RUN(s) that service the corresponding business function. Using
a combination of automated and manual techniques, the analyst extracts the input, output
and literal fields of each captured screen. Then the analyst
associates screen fields to variables and/or database fields. (4)
Iterative review cycles, with input from your experts, help quantify our findings.
(5) Use of web portal technology helps with posting, notifying, collaborating, and
coordinating our efforts.
After each cycle, a decision is made to publish or not. (6) Publication of our findings
provides both management summary and web-based documentation portal. See more in
Results from MCSI Services. (7)
See also: MAPPER CSI Tool Architecture